Infographic link building is one of those link building approaches that a lot of SEOs, link builders and site owners are intimidated by because it involves some graphic design.
Don’t worry, you don’t need to be an Adobe Creative Suite pro to build great infographics, but it is true that to pull it off, an infographic does need to look good.
Done correctly, an infographic can be a great linkable asset that lets you really boost your organic traffic, improve your rankings and build brand awareness.
In the below article, we’re going to take a deep dive into what is involved in the creation of a great piece of infographic content, how to market it to get backlinks, and the various benefits of creating and sharing infographic content.
So, first things first, what is infographic link building?
Put the words “information” and “graphic” together, and it’s pretty self-explanatory.
It’s information, displayed visually.
Infographics are usually a combination of written information and images which tell a story or depict a concept for the viewer.
You can use infographics as part of a general link building strategy or as part of a single campaign, but either way, they can land you some very high quality links, especially if you are displaying novel data in interesting ways.
The benefits of an infographic link building strategy
There are a lot of good reasons to incorporate infographic link building into your link building arsenal.
Creating infographics:
- Helps boost your rankings in the SERP.
- Improves your website metrics
- Increases organic traffic
- Is a cost-effective way to build backlinks
- Improves engagement
- Establishes brand authority and awareness
Rankings boost

A compelling infographic can build you a lot of high authority backlinks, which send trust signals to Google that the page hosting that infographic is worth showing higher up on the search engine results page.
Better website metrics
One of the main ways that an infographic can improve your website metrics is through his ability to increase the total time someone spends on your site.
The amount of time that a person spends on your website (usually referred to as “dwell time”) is something that a lot of SEO experts consider to be an important ranking factor.
More traffic
Infographics not only improve website traffic by doing things like increasing dwell time and moving you up the search engine results pages, but they are also extremely shareable.
Shareability means not only can you get a huge boost in referral traffic from an infographic, but they can produce a great compounding link effect. The more an infographic gets shared, the more people see it and consider linking to it, and on and on.
Cost-effectiveness
Link building can get quite expensive, especially if you are planning on doing it at scale. Long-form resource pages and linkable assets can take a long time and a lot of money to make.
Infographics tend to be a great bang for your buck. The point of an infographic is to cut down on the amount of reading a person has to do. You use visuals to tell the story.
Once you’ve got a good process in place, you can create a compelling infographic in less time with equal and often even better linkability.
Improved engagement
Not only do good informational infographics result in people spending more time on a page (or even your entire website), but they are also memorable. If you are able to explain or convey something graphically, people are more likely to remember it and probably more likely to come back for more.
If you establish a reputation as a good visual storyteller, it’s more likely that you’ve got a repeat visitor on your hands.
Improved authority and brand awareness
A good infographic can go a long way to helping establish you as a trusted brand authority. This is because visuals mixed with written information are almost always more compelling and convincing than just the written word.
The different styles of infographics
Different types of infographics have different applications.
There are various styles and categories that are used for different purposes, with each one more or less suitable for a given purpose.
Below are some of the different format types for infographics.
Statistical infographics

Statistics infographics are, as you probably guessed, used to show statistical data and can be great ways to add some evidential weight to your content and help reinforce any concepts or arguments.
They include things like charts, graphs, heatmaps and other numeric portrayals of data. They are often employed to simplify complex information and to help paint a picture with numbers.
Timeline infographics
Timeline infographics are useful when portraying anything sequential–events, achievements, a history of something.
Whether you’re trying to convey a historical process or evolution or are laying out your company’s trajectory from inception to present, timeline infographics work great.
Here are some of the most popular timeline templates on Canva.

Process infographics

Process infographics can be very helpful for illustrating how to do something that would otherwise take a lot of words, or perhaps even be quite difficult without accompanying visuals.
Flowcharts, pathways and other diagrams help readers move through the different stages or steps in a process.
Comparison infographics
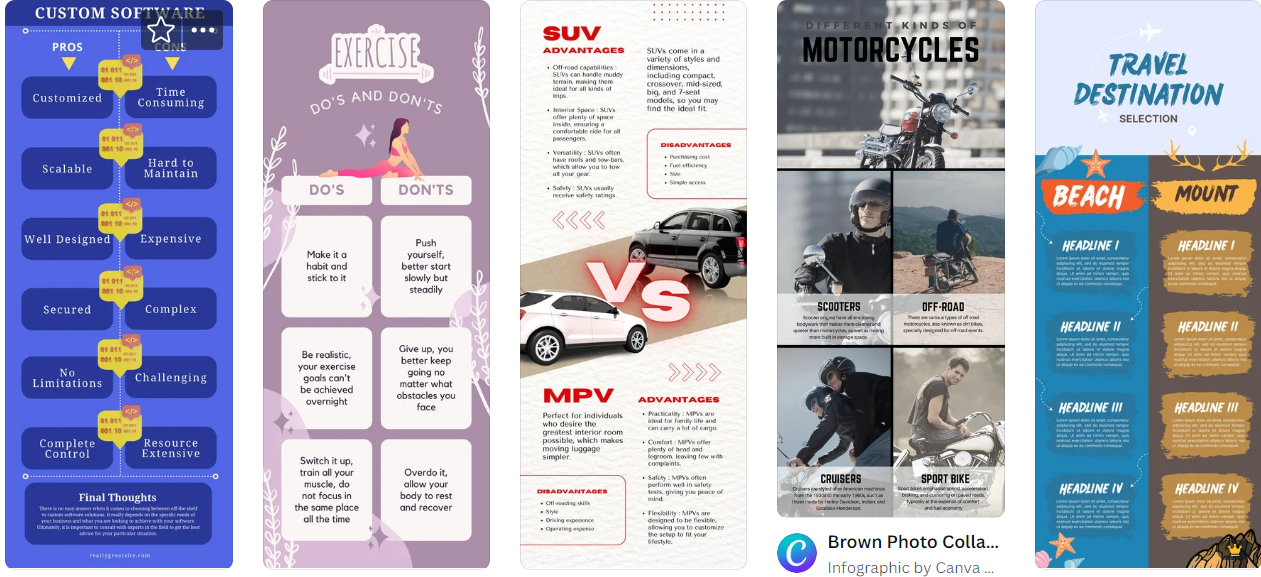
Comparison infographics are for when you’re trying to show two things side by side
Hierarchical infographics

These types of infographic, which are also known as “geo infographics,” make use of hierarchical elements in a top-down fashion to help depict the hierarchical nature of something.
It could be relationships or the importance of a particular series of steps or processes.
Geographic infographics
These are pretty straightforward. They display geographical data either to highlight patterns across a geographical area or to convey specific information about that place.
List infographics

List infographics are definitely one of the most commonly used infographic styles.
A written list with visual accompaniments is a very effective way to get your point across while keeping things engaging.
Is infographic link building difficult?
Once it became clear that you could create infographics and build high quality links, a lot of people started incorporating them into their link building campaigns.
It is no longer one of those “hidden gem” tactics, which means that the infographic link building space has become quite competitive.
That said, if you stick to the recommendations and information presented in this article, you should be able to make infographic link building work for you.
What decides whether people want to publish your infographics or not boils down to your understanding of what makes an engaging visual.
Creating infographics that engage
The foundation of a good piece of infographic content is a good understanding of the visual medium more broadly. You need to know what makes a piece of visual content compelling, infographic or otherwise, before trying your hand at infographic link building.
The importance of strategy
When you’re building backlinks, you need a link building strategy. What are you hoping to achieve with a particular link building campaign and how will you achieve your goals? What kind of link building outreach will it take?
Having your roadmap in place before starting out will stop you from meandering and going off course, potentially wasting time and money.
Commit to quality
Because there are so many people creating infographics nowadays and because platforms like Canva (and others) have made it so easy to create good-looking plug-and-play infographics, you really need to provide quality if you’re going to stand out.
You usually see much higher ROI spending more time on fewer projects than tryin to churn out as much as possible and seeing what sticks.
Make sure your design is thoughtful

It’s ok to use a Canva template for inspiration, but the best infographics are customized and unique.
If you’re choosing something off the front page of Canva and not really doing anything to make it yours (which is what most low-effort infographic link builders do), fewer people are going to take notice of it.
Do better research than the competition
In order for someone to want to give you their time (which is what you’re asking them to do with content), you need to make it worth their while.
Spend a significant amount of time researching your topic and gathering information. What’s more, for your infographic content to actually establish trust and authority, you need to present relevant, current and factual information.
Infographic building 101
It doesn’t matter whether you create infographics for yourself, your clients or a brand, there are some tried and true steps you can take to build great visual content.
For the sake of coherence and making our points, the below steps will use a hypothetical personal trainer as the content creator.
First step: establish your concept
First things first, you need to decide what your infographic is going to try to communicate and then figure out a corresponding design that will convey it.
A helpful tool for this part of the process is to use something like visual.ly/tag/fitness (the last part of the URL should be your niche) and then look for the most popular (i.e., the most favorited) infographic for that particular tag.
This will help to give you a better idea of what could work.
It can also give you better ideas for topics that are both relevant and shareable.
After you’ve done this, you can add more options to your list by using Ahrefs and searching for something like “fitness infographic.”
Filter the results by referring domains and then select several that you can see have garnered a lot of inbound links.
Add these to your infographic master list.
Come up with a handful of ideas that incorporate your favorite elements from all of the various infographics you have gathered.
Second step: research
Once you’ve got a title picked out and your concept established, you need to make sure to include all of the relevant data points. More importantly, you need to check and double-check them for accuracy.
Nothing erodes credibility like factual errors.
If you’re using a service to build your infographic, depending on the service in question, they will do the research for you. It’s usually better to do it yourself, however, since you want to be sure to do thorough due diligence.
There are basically two ways to gather data:
- You can either use data that is currently being used in existing infographics (being careful not to plagiarize, of course, you want an original piece of content).
- Spend some time searching the internet and compiling, cross-referencing data points.
Always make sure to include a “bibliography” in your infographic content, including source URLs and any other relevant attributions.
This establishes credibility and shows that you’ve considered multiple sources of data when building your infographic.
Third step: creating the link building infographics
You can’t execute an infographic link building campaign without the infographic.
This is the step where you take your concept and research and combine the two into powerful infographics for link building.
There are basically two options you have when creating an infographic: build it yourself or outsource it.
Creating a compelling piece of infographic content requires some graphic design skills.
You don’t need to be an expert, but you should know your way about programs like Canva and some of the Adobe Creative Suite programs like InDesign, Lightroom and Photoshop.
If you don’t have the time (or inclination) to create your own infographics, and you don’t want to work with an agency, you can always reach out to freelancers on platforms like Upwork.

Make sure the project’s scope and specific requirements are clear so that you minimize the amount of back-and-forth and reworks.
Show the person examples of the kinds of infographic content you are aspiring to create so they have something to work off of.
Fourth step: reaching out
The fourth and final step is to reach out to websites that you think would be interested in linking to your infographic.
By now, you should have published the infographic on your website, accompanied by some quality written content.
You can put together your outreach list using a few different tools, but Ahrefs is probably the best for pure link building.
Ahrefs

To use Ahrefs, take the list of successful infographic URLs that you collected earlier and put them into the site explorer.
Set the filter to “one link per domain” and then export the backlink profile as a CSV file.
Open your list and pull both the referring domain and the specific referring page for each URL and add those to your outreach list.
The domains are the websites for which you’re going to find contact information and the individual pages are the ones you will reference when pitching the site owners your infographic link.
A couple of outreach tips
In order to maximize the odds that someone will give your infographic content the time of day, do the following:
- Include an Imgur link for the recipient to click on. People are more likely to click on something from a trusted third party, and they will like the fact that you are not forcing them to visit your website.
- When you follow up, include an embed code to make using the infographic as effortless as possible for them.
- If a website does end up using your infographic but doesn’t use the embed code, make sure you reach out and ask if they can include a homepage citation.
- Send at least one (ideally two) follow ups, while always giving the recipient an easy way to opt-out.
Using infographics to create more link building opportunities
Link building is becoming both more competitive and more necessary every year.
People know that in order to rise up the rankings, increase organic traffic and increase conversions, you need to trust signals from high authority, relevant websites, in the form of backlinks, to show Google you are worth showing in those coveted top SERP spots.
Infographic link building can be a fantastic way to stand out from the crowd and provide a lot of value to websites in your niche. People want to see and engage with interesting, dynamic, visual content.
You just have to commit to creating and delivering high quality.
You also have to accept that this kind of link building is just one type of link building–part of a larger arsenal of diversified tactics that aims to create a diversified backlink profile.
Dofollow employs a range of proven link building and outreach methods, cultivating relationships and finding opportunities, to land huge links for our clients.
Get in touch with us and find out more about how our transparent, user-centric, performance-based link building can help skyrocket you up the search engine results page.
Why Trust Us On SEO
Eric Carrell & Sebastian Schaffer have been working in SEO for over a decade, building their own projects - understanding and testing SEO strategy, along with building hundreds of white hat links per month for our projects. They take their learnings and experience and apply them to the strategy that drives our link building strategy for our clients.
Eric & Seb have always believed in quality over quantity, doing things the right way so we future proof our client’s websites against future Google updates and the evolving industry of search.
While Seb handles the company strategy around culture, processes and structure, Eric is constantly working to improve our service offering, customer experience, and following the industry in parallel with Google’s Quality Guidelines so that we are always one step ahead of our competition and aligned with what Google wants to see for your site to rank higher.